

Deep Focus (Deep Work Timer) measures the time you choose to spend on a project and keeps saved sessions for later review. Use it for reading, study, coding or another named task. The timer counts up from zero; you decide when to pause and finish. A recorded duration describes time tracked in the app, rather than measuring the quality of your concentration or the work produced.
Record your first session
- Open Projects and add a project, such as Reading. Enter a name, choose a color and add a description if useful. Select that project for the timer.
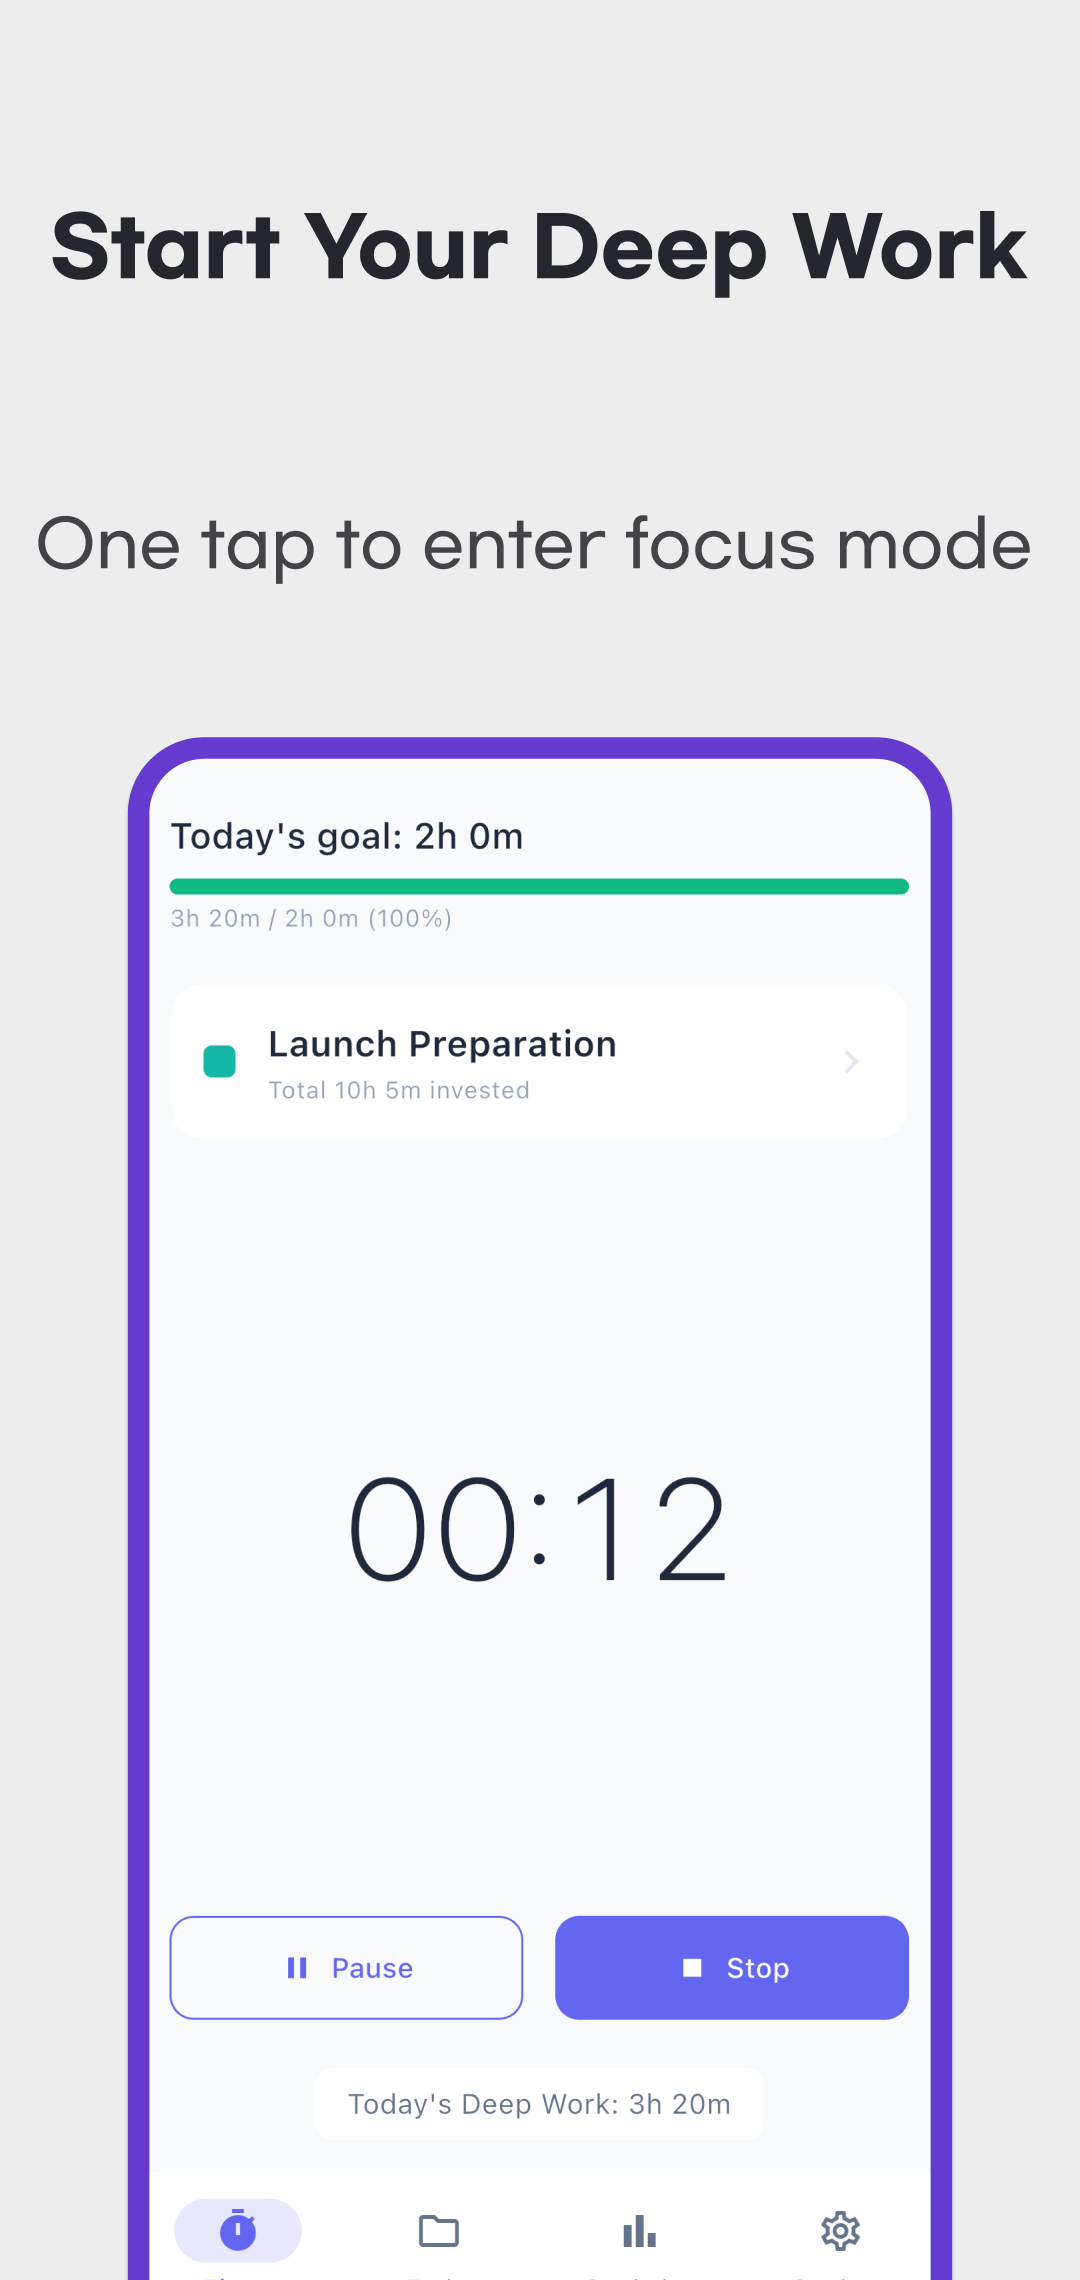
- Return to Timer and tap Start Focus. The elapsed time increases until you pause or finish; there is no preset work-and-break cycle to complete.
- Use Pause when you stop working and Resume when you return. Paused time is excluded while continuing the same session in the app.
- Tap Stop when finished. The finish flow saves sessions lasting at least 60 seconds of counted time. A shorter attempt shows a minimum-duration message and is not saved.
- If session notes are enabled, add a short memo about what you did. Then check the project’s session history or the calendar date to confirm the record.
Settings includes switches for session notes and keeping the display on during a running timer. Keeping the screen on does not prevent notifications or block other apps.
Organize projects without losing their history
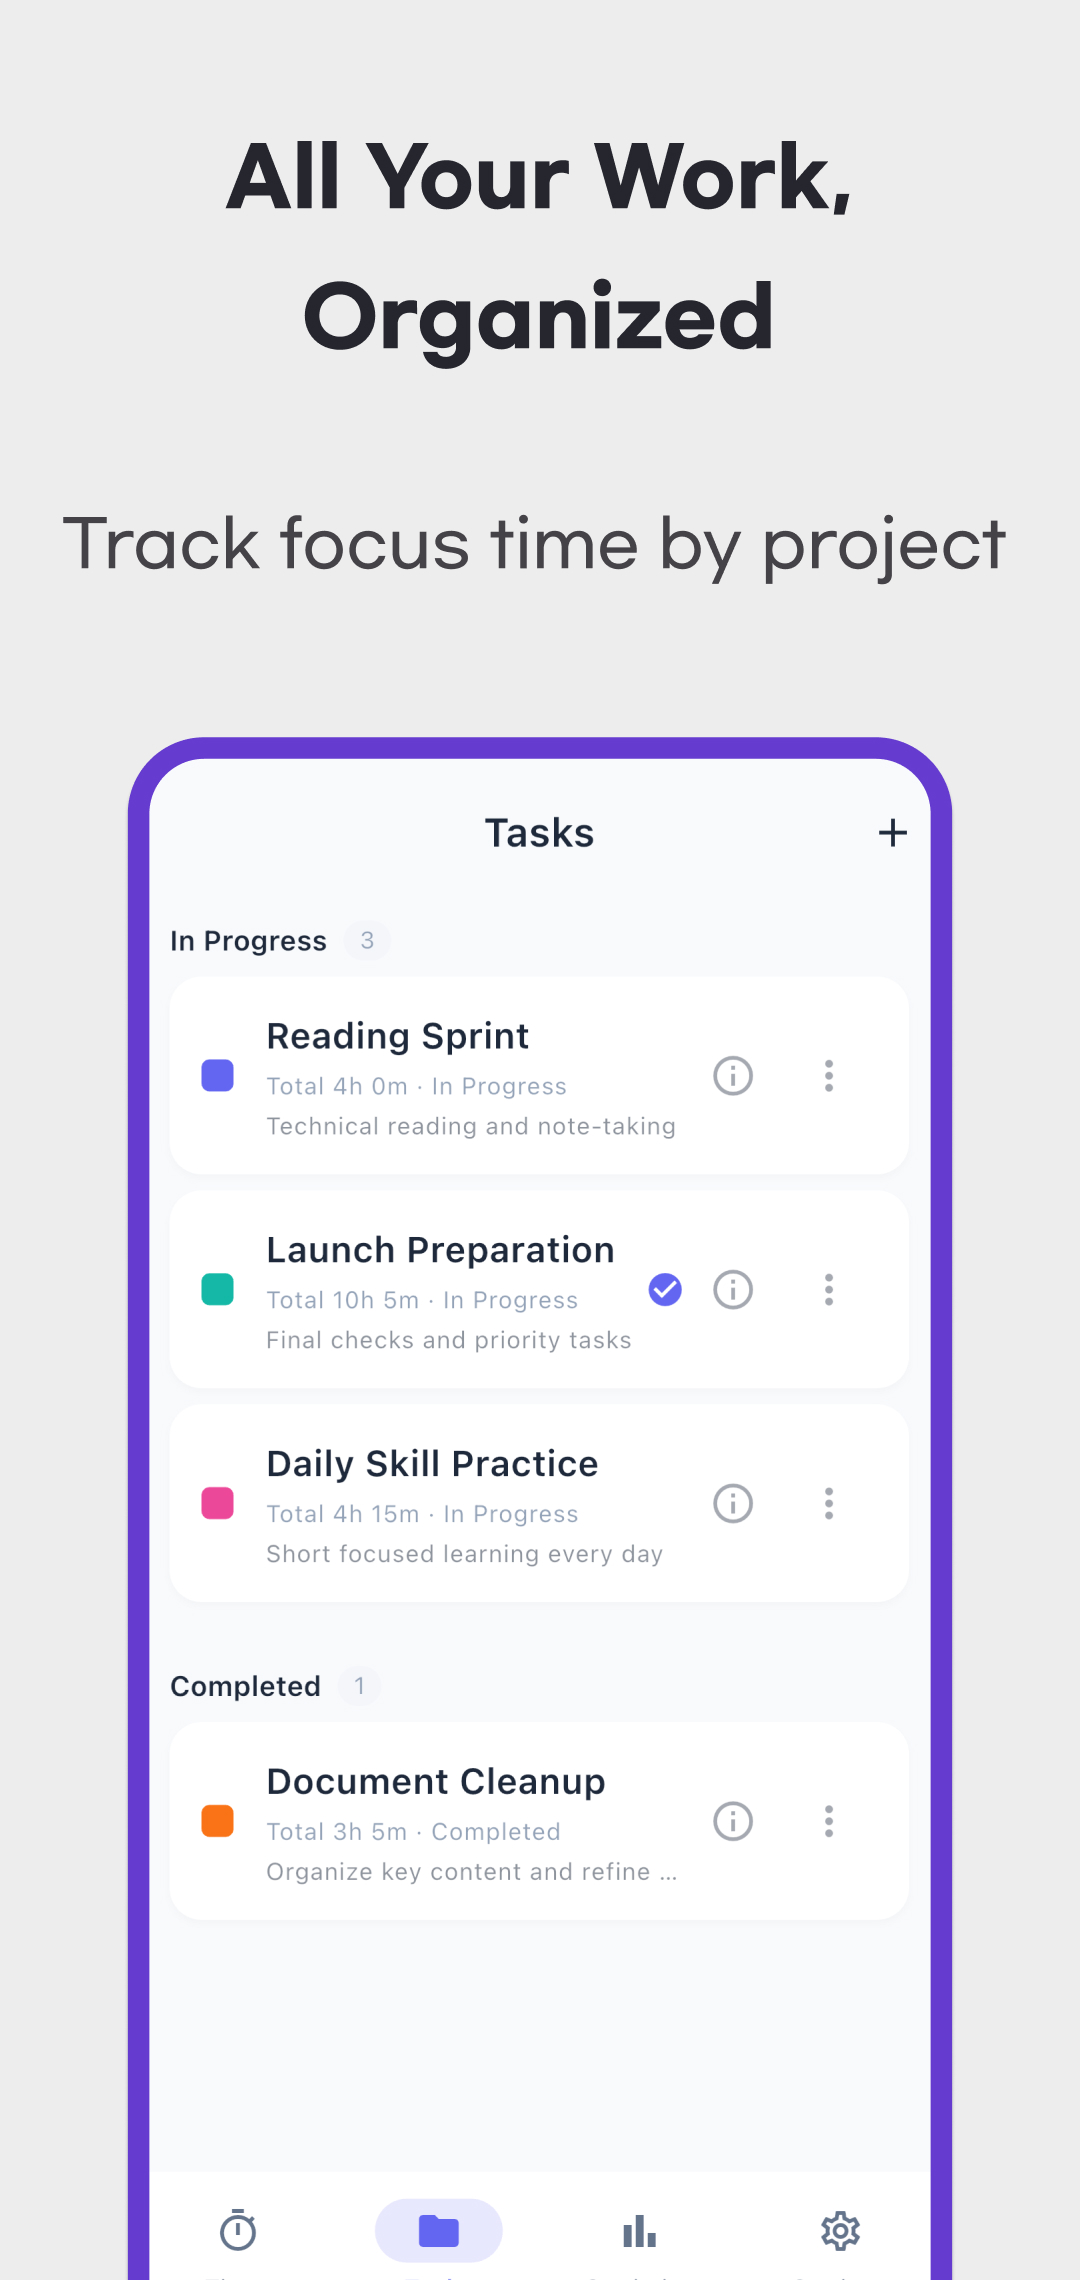
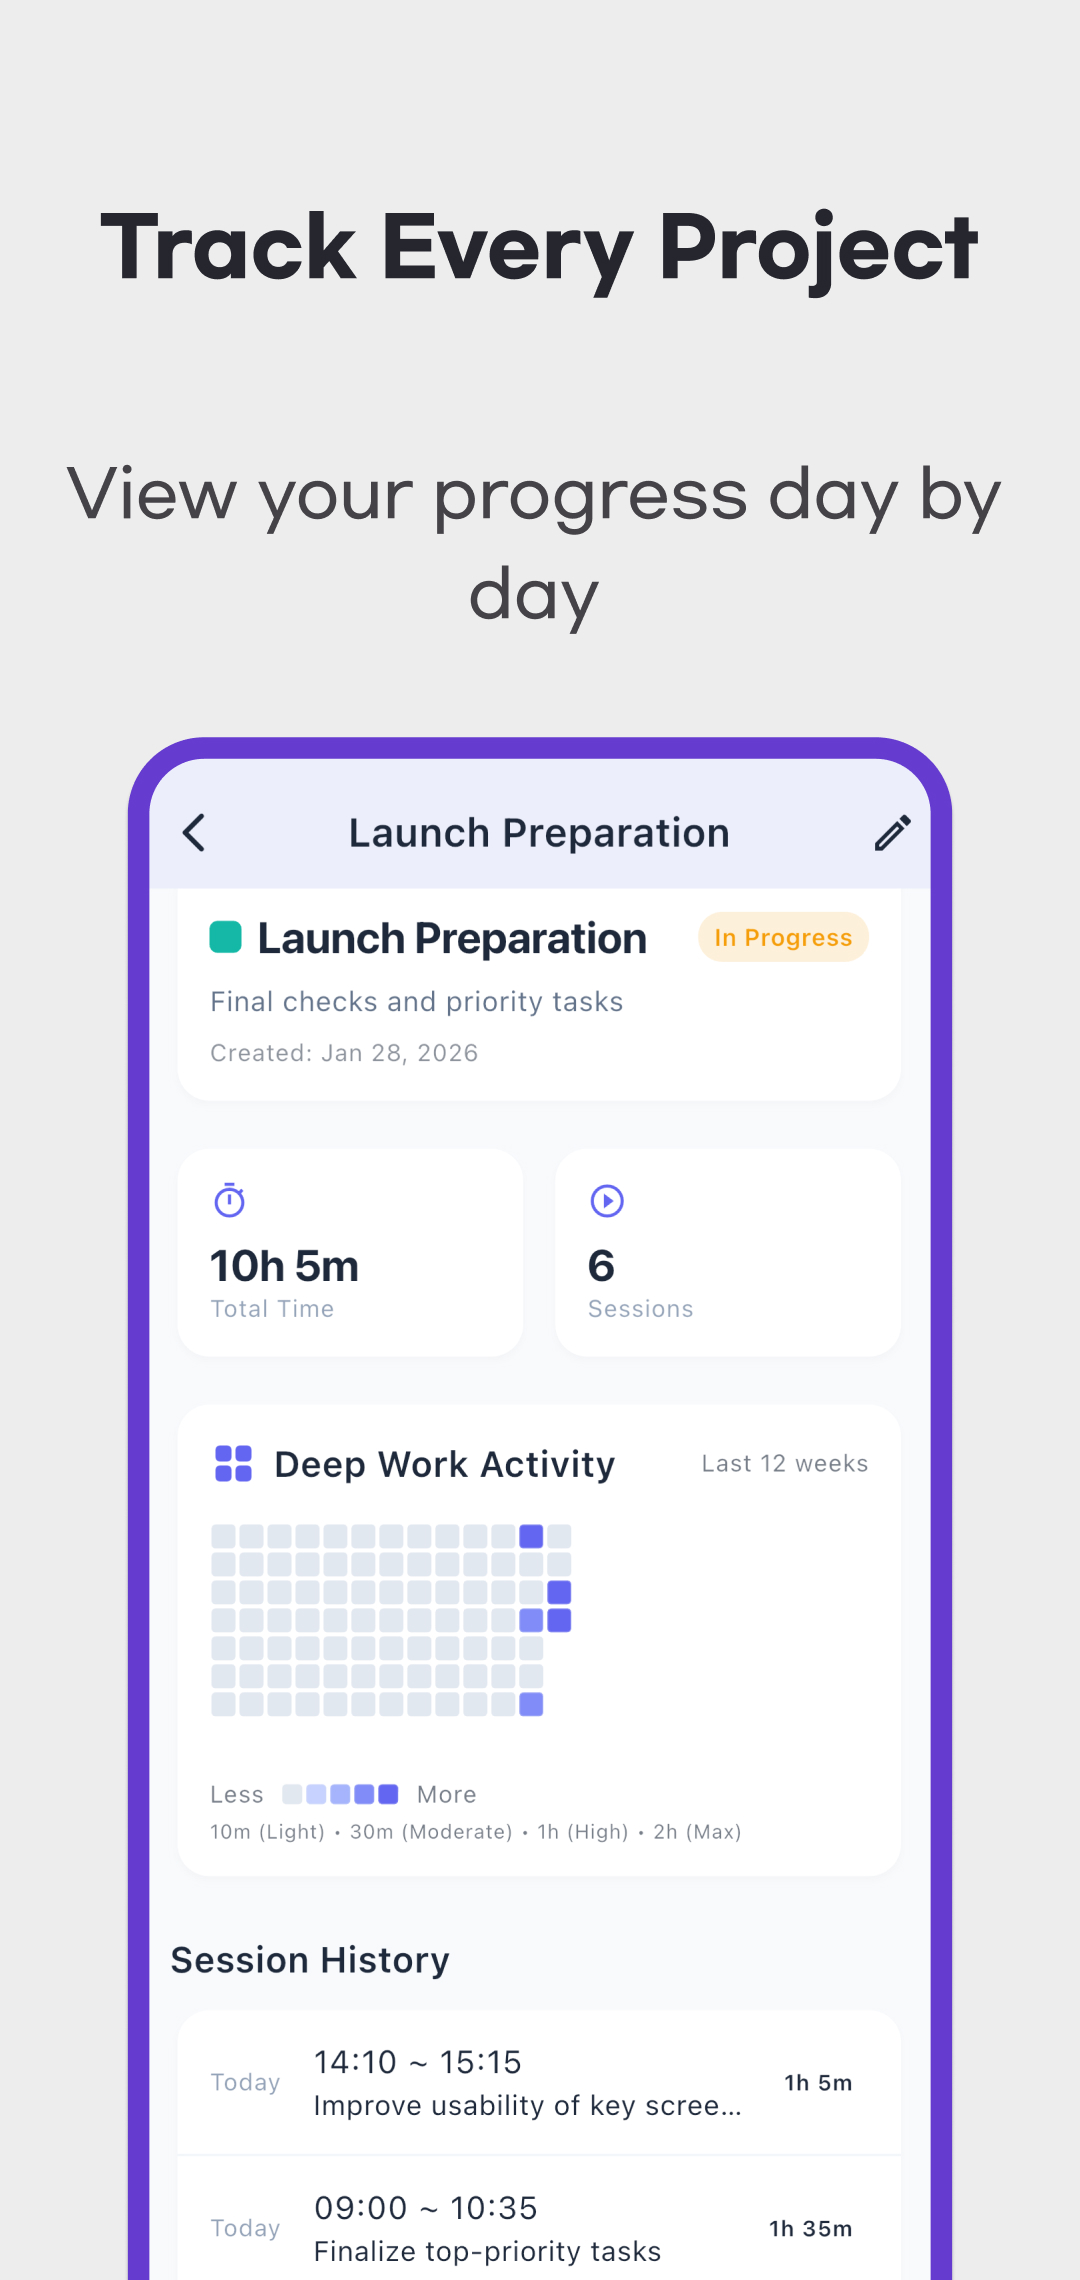
A project has a name of up to 50 characters, an optional description of up to 200 characters and a color. Its detail page shows accumulated recorded time, session count, an activity heatmap and session history with any notes.
Mark a finished project Completed to retain its sessions in a separate status. Reopen it if you want to use it again. Deleting a project also deletes its associated sessions and changes totals calculated from those sessions. Use completion when you want to keep the history.
Read the daily goal correctly
The initial daily goal is two hours. Change it in Settings → Daily goal, then check the saved value. A goal is a reference for your recorded time; it does not stop the count-up timer or start a break automatically. Available picker values can vary by app version, so use the values shown in your installed app.
| Saved time today | Daily goal | Timer goal indicator |
|---|---|---|
| 45 minutes + 45 minutes = 90 minutes | 120 minutes | 75% |
| 120 minutes | 120 minutes | 100% |
| 150 minutes | 120 minutes | 100%; the recorded duration can exceed the goal |
The indicator is capped at 100%. Streaks refer to recorded goal-achievement days, rather than verifying a learning or productivity habit. Changing the goal does not rewrite earlier achievement records, so compare streaks with the goal you used at the time.
Use the charts to find records, then check the sessions
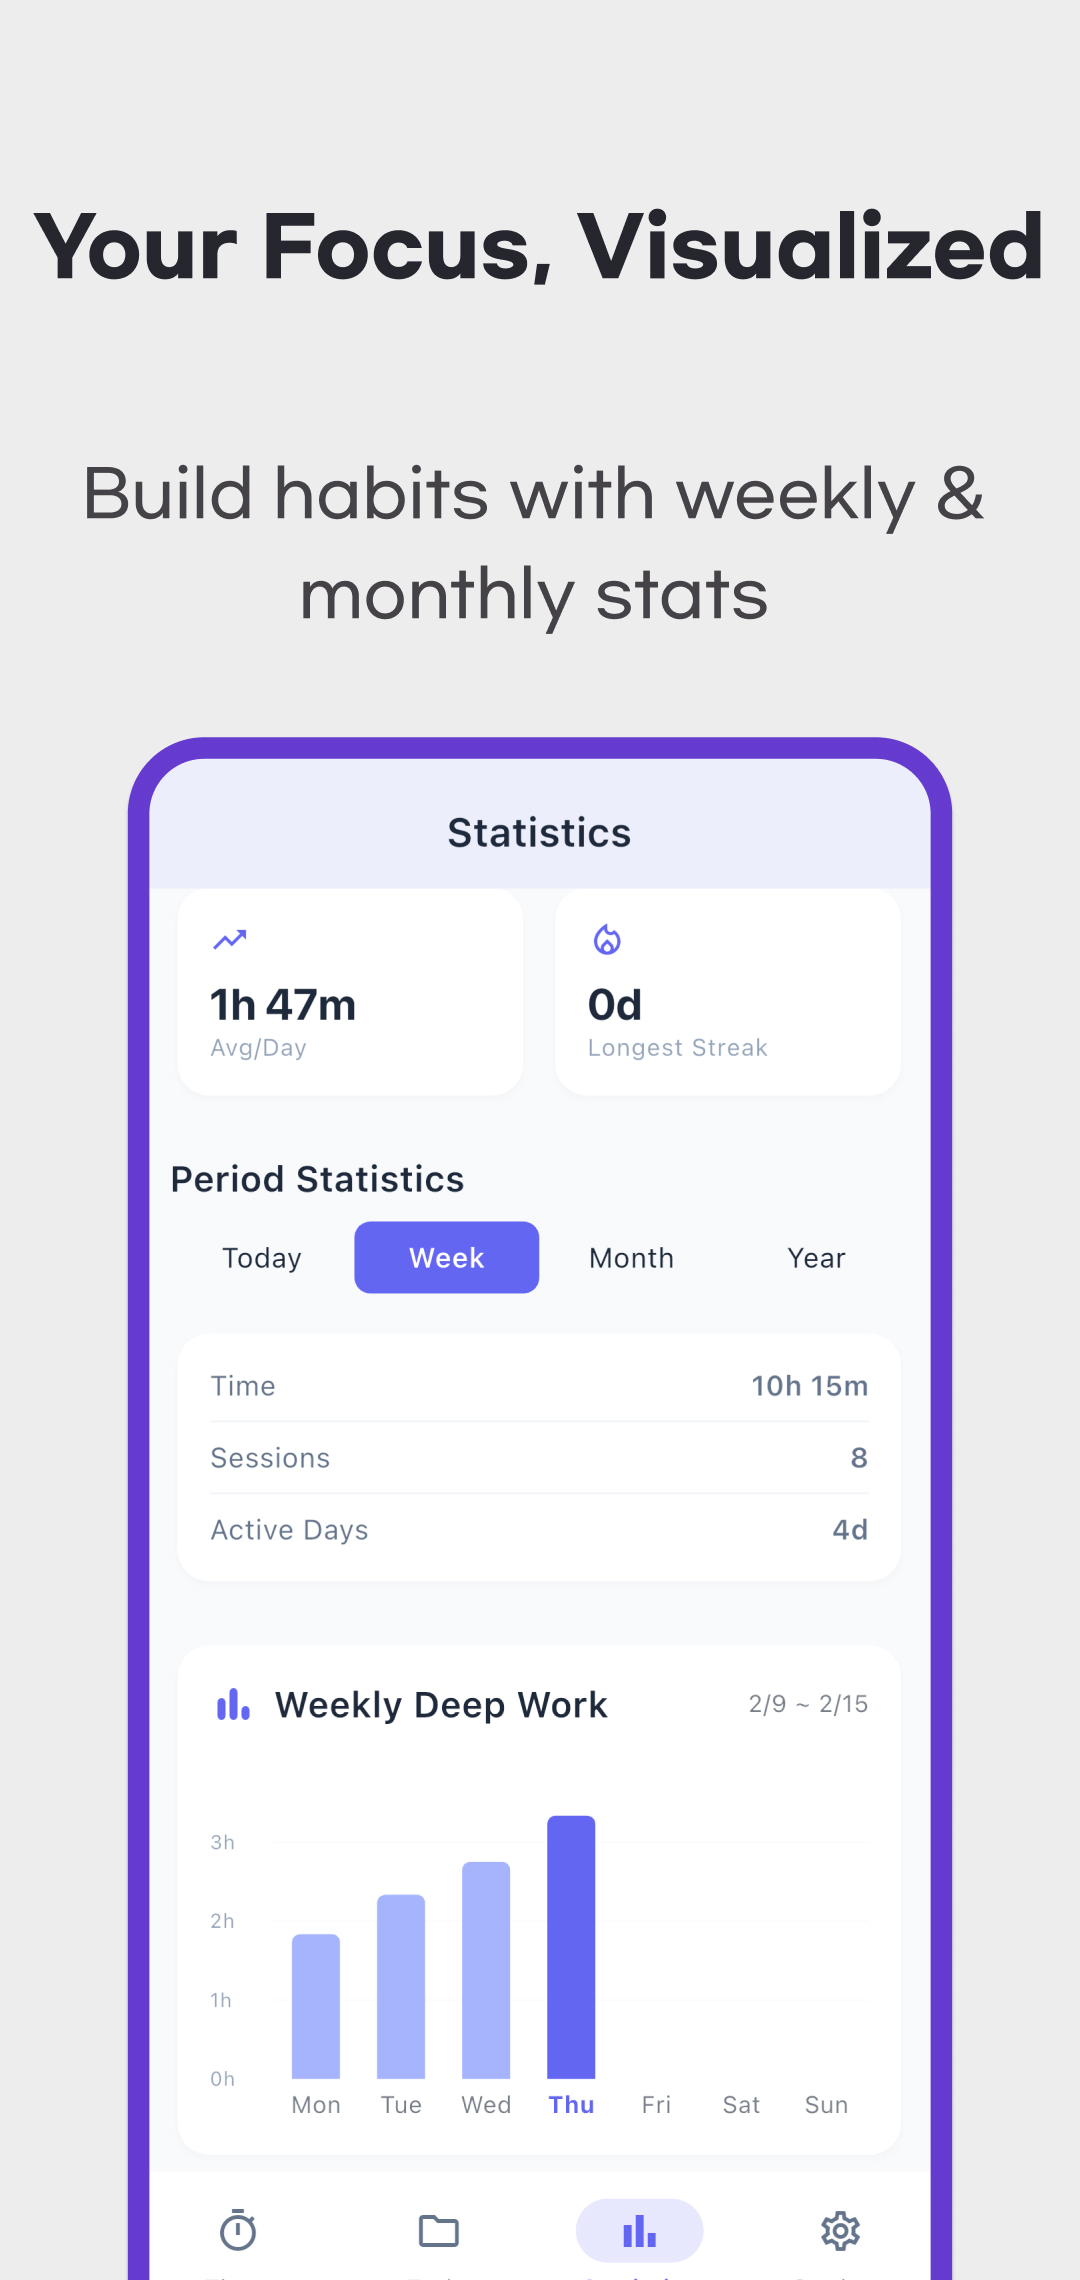
Statistics offers Today, Week, Month and Year summaries. The weekly bar chart covers Monday through Sunday. The monthly calendar lets you move between months and tap a date to open its session list. The activity heatmap is labeled “Last 12 weeks” and uses progressively darker colors, with legend thresholds at 10, 30, 60 and 120 minutes. It does not identify your best hour of the day.
Small differences between views can come from how minutes are displayed. For example, two sessions lasting 1 minute 59 seconds each contain 238 seconds altogether. The weekly chart uses those seconds, while the same-day heatmap adds each session’s whole minutes and shows 2 minutes in its tooltip. Calendar session rows show 1 minute for each record. Check individual records when comparing a short session with a chart.
Sessions that cross midnight need extra care: daily totals, weekly bars and calendar session lists group by the session’s start date, while the heatmap can split time across dates. A pause spanning midnight can also affect that split. These views are for reviewing your app records; check the original timing separately before using them as a formal timesheet.
Returning to an interrupted session
When a saved active session is available and was saved less than 12 hours ago, reopening the app may offer a recovery prompt. Review the project and elapsed time before choosing Continue or Start New. Start New can save the previous counted interval if it meets the one-minute minimum before clearing the saved state; it is not simply a discard button. Recovery after interruption or a paused restart can include time away from the app, so check the resulting record.
Projects, sessions and settings are stored locally. The current app has no in-app account sync or record export flow. Keep a separate copy of records you need before deleting a project, clearing app data or changing devices. Local record storage does not make the entire app network-free: the store listings disclose advertising.
Download and support
Use the Google Play or App Store links in the download section below for current availability and requirements. See support for questions and the privacy policy for data handling.